Draw a line chart with Blazor and SVG
Martijn Storck
To me, Blazor is the coolest thing web development has seen in a while. It allows developers to rapidly build component-based Web Applications using ASP.NET Core tooling and C#. However, a large portion of the web is based in JavaScript and it’s tempting to pull in JavaScript dependencies for common things like for example charts.
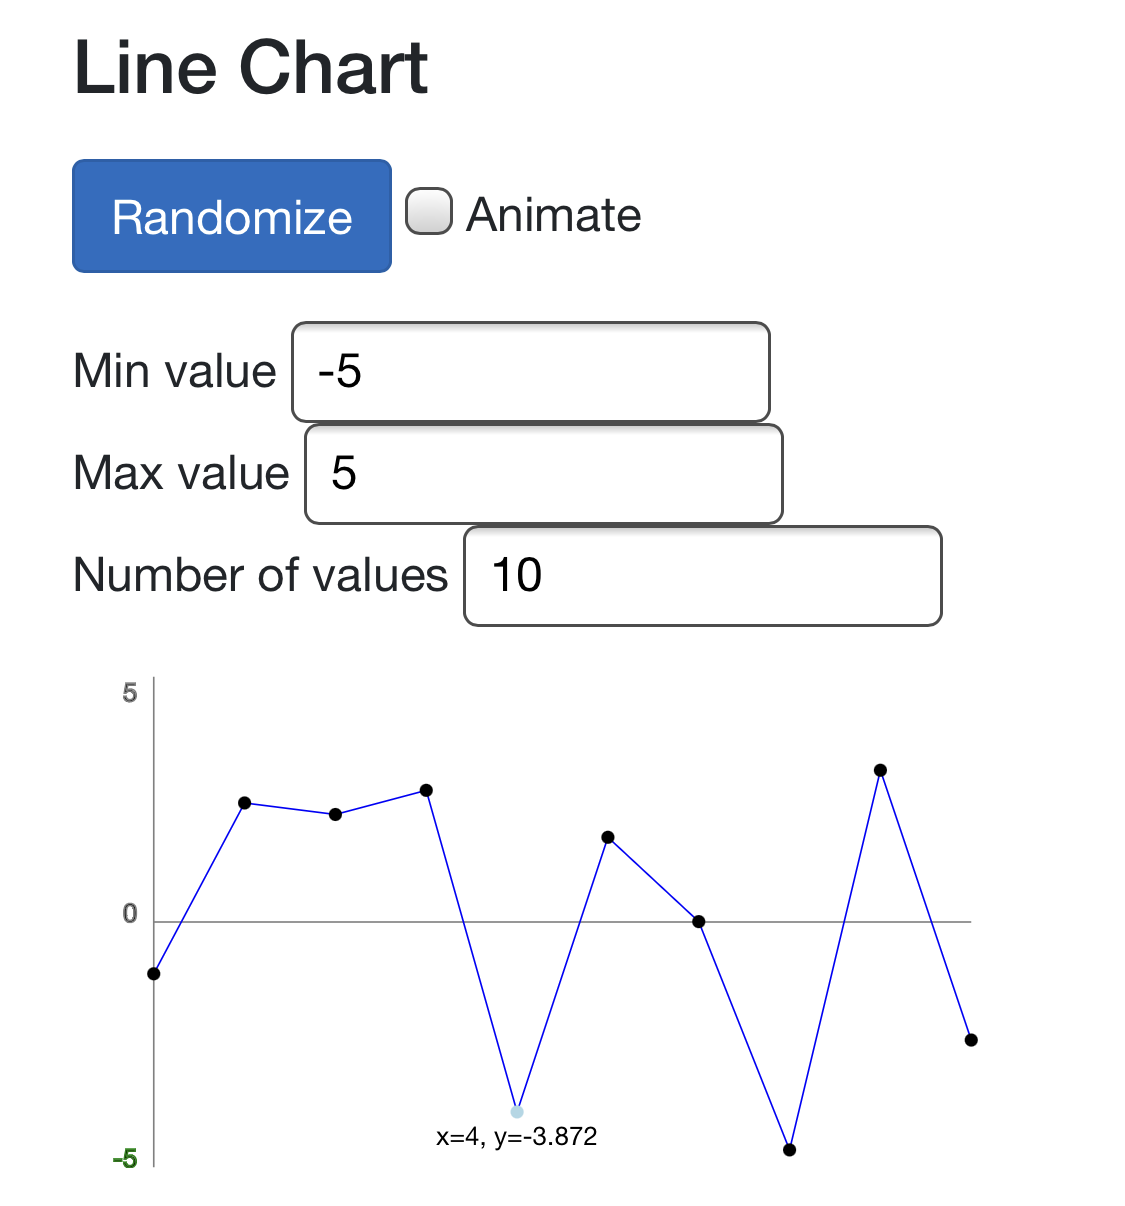
This made me wonder: can I build SVG files using Razor syntax and is that a good idea? The answers are yes, absolutely and yes, definitely! I will briefly explain below but definitely check out the code on GitHub and the result.

Using the LineChart.razor component
Using the LineChart component in a razor file is easy. From Pages/index.razor:
<div>
    <LineChart Values="@Values" Min="@Min" Max="@Max"/>
</div>
The Min and Max parameters define the boundaries of the Y axis
and Values is a List<double> of data points. The component
renders an SVG file in-line.
The index file contains some code to generate random values and modify them continuously when the ‘animate’ checkbox is ticked.
Building SVG in Razor
SVG is a vector graphics format that is based on XML. This lead me to the idea to build SVG files with Razor syntax. The result is in Shared/LineChart.razor, which I suggest you view on GitHub.
Even if you don’t know SVG, the following Razor snippet should look familiar and is used to render the circles for the data points.
@foreach (var (x, y) in Values.Select((value, index) => (index, value)))
{
    <circle cx=@(Xpos(x)) cy=@(Ypos(y)) r="4" fill=@(x == _selectedPoint ? "lightblue" : "black")/>
    @* Render a transparent circle with a larger radius to provide a proper hitbox *@
    <circle cx=@(Xpos(x)) cy=@(Ypos(y)) r="20" fill="transparent" @onclick=@(_ => _selectedPoint = x)/>
}
The Xpos and Ypos methods convert the point data to coordinates in the SVG graphic. Note that
two circles are drawn: on line 3 we draw the actual black circle and on line 5 a slightly bigger, transparent
circle, to which we attach a Blazor onclick event. That’s right! Blazor events work for SVG just
as they do for JavaScript. I was kind of surprised about that but it makes sense seeing how browsers
handle SVG. The generated HTML looks as follows:
<circle cx="50" cy="18.884763656402555" r="4" fill="black" b-dca6o0hlbn=""></circle>
<circle cx="50" cy="18.884763656402555" r="20" fill="transparent" b-dca6o0hlbn=""></circle>
Charts with seriously little code
Blazor handles a lot of the heavy lifting for us as developers. The chart will automatically redraw when the values are changed, including the label of the currently selected data point. The entire LineChart component comes in at under 70 lines and has no dependencies on external JavaScript or C# libraries. Pretty cool! The Blazor charting libraries I found currently still rely on JavaScript helpers but I see no reason not to go full native Blazor.
The LineChart component was extracted from another project of mine, P1Dash a simple web interface to monitor the power consumption or production for Dutch Smart Meters. That component has some additional features so definitely check it out if you want to see more!